Most ecommerce operators spend 90% of their mental energy obsessing over top-of-funnel acquisition metrics: Meta and TikTok ROAS, blended CAC, email click-through rates, and Google Ads CPCs.
Yet two stores in the exact same niche, spending the exact same $40,000 monthly ad budget, will regularly end the quarter with radically different bank balances. Store A converts traffic at 3.1%, preserves a 58% blended gross margin, and turns over inventory every 45 days. Store B languishes at a 1.3% conversion rate, watches margins dissolve into emergency clearance fire sales, and has warehouse shelves groaning under unsold boxes.
The differentiator almost never lies in ad creative. It lies in catalog health.
When shoppers arrive on your storefront, your product catalog is your operational engine. If that engine is cluttered with out-of-stock ghost products, broken faceted search filters, inconsistent pricing rules, and dusty SKUs nobody wants, your customer acquisition dollars evaporate the second visitors hit a collection page.
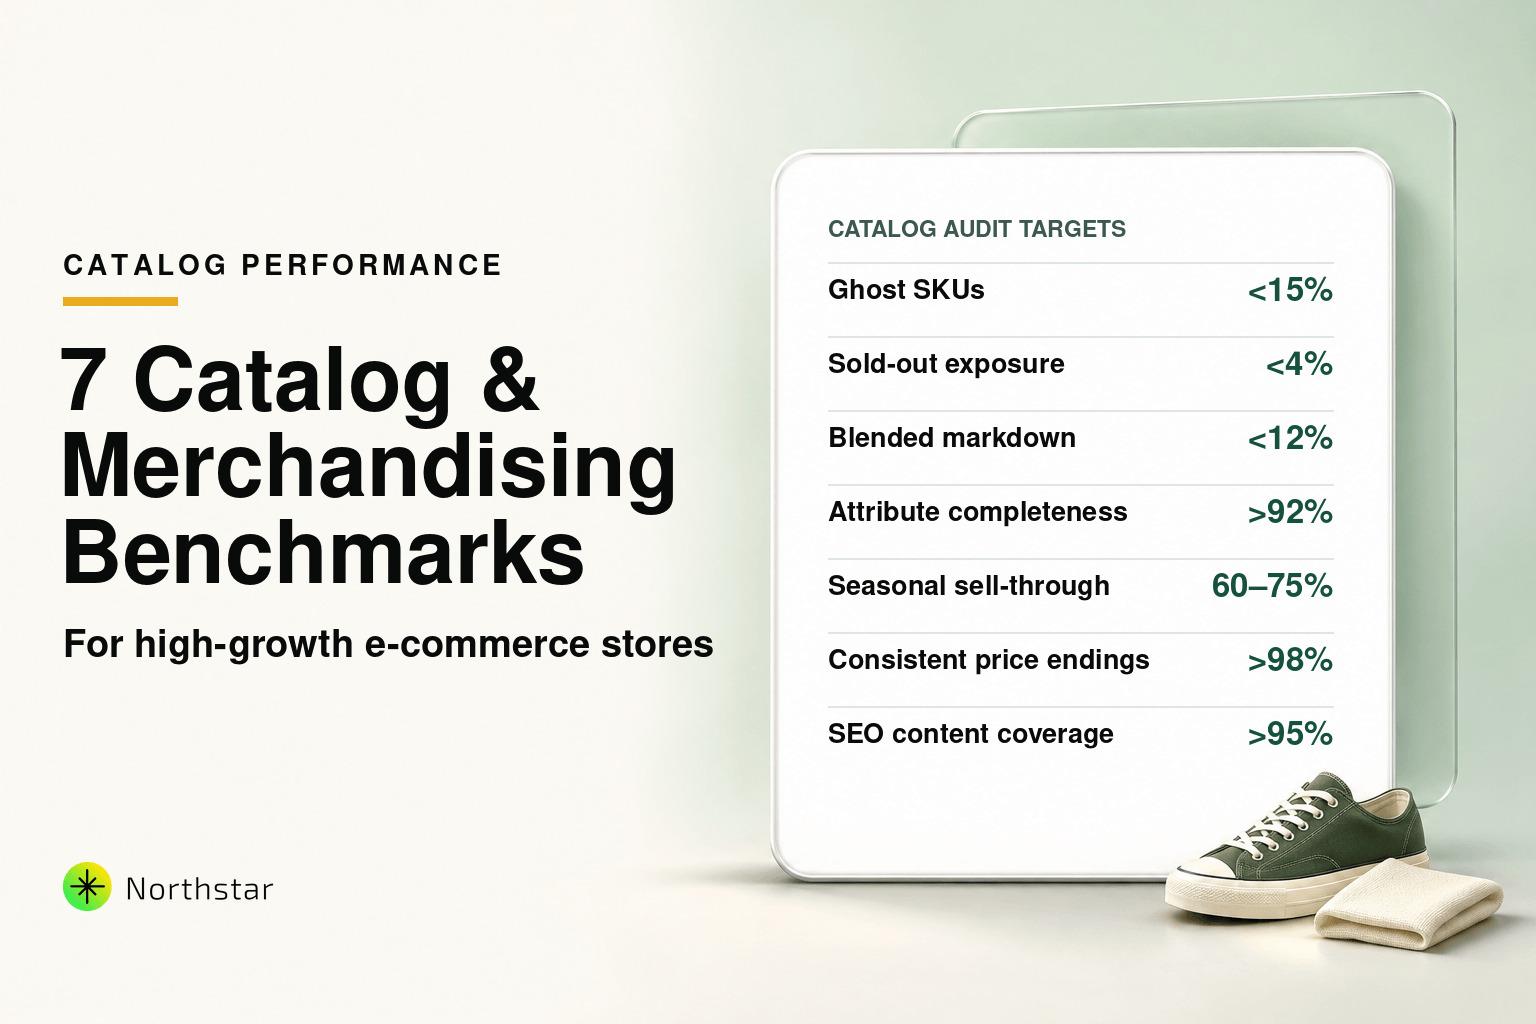
To help you audit your store's merchandising health, we analyzed catalog performance metrics across high-growth Shopify and BigCommerce stores. Here are the 7 essential catalog and merchandising benchmarks every scaling brand needs to measure, understand, and optimize.
Benchmark 1: The Ghost SKU / Dead Inventory Ratio
< 15% of Active Catalog
A Ghost SKU is an active, published product sitting in your storefront that has recorded zero customer purchases in the last 90 days.
In mature stores with catalogs ranging from 1,000 to 50,000 SKUs, catalog creep happens silently. A seasonal campaign ends, a trend cools off, or a size range gets broken, but the products remain active. Over time, dead stock creates severe operational friction:
- Search Degradation: Dead products clutter your internal site search and native collection grids, pushing bestsellers below the fold.
- SEO Crawl Waste: Search engine bots spend limited crawl budgets indexing zombie URLs instead of ranking your core high-margin revenue drivers.
- Distorted Analytics: Thousands of zero-velocity SKUs artificially drag down your catalog-wide average conversion rates and inventory turnover calculations.
The Fix: Run a quarterly catalog audit. Use an operational tool like NorthStar Bulk Product Editor to filter products with zero 90-day velocity, use the bulk tag editor to tag them with clearance-tier-1, and apply an automated markdown rule. If stock remains after 120 days, bulk unpublish or move items to draft status while keeping proper 301 redirects in place so you never leak backlink equity.
Benchmark 2: Out-of-Stock (OOS) Visual Exposure Rate
< 4% of Top Collection Real Estate
Nothing kills consumer buying momentum faster than opening a curated collection page (e.g., "Women's Linen Blouses") and seeing 3 of the first 8 items stamped with gray "SOLD OUT" badges.
Consumer psychology data is unequivocal: when out-of-stock items occupy more than 8% of the first page of any collection, bounce rates jump by 27%, and overall category conversion drops by up to 14%. Shoppers conclude your store has poor availability, abandon their cart research, and return to Google.
Yet many merchants hesitate to completely delete or hide out-of-stock products because they don't want to lose organic Google search rankings or break incoming social media links.
The Fix: Implement rule-based inventory tiering. Set up automated rules that trigger when inventory dips:
- When variant stock reaches 0, automatically tag products when out of stock to exclude them from dynamic ad feeds and demote them to the bottom of collection sort orders.
- As inventory approaches depletion (e.g., fewer than 5 units left), consider automatically adjusting prices upward to maximize revenue on scarce stock rather than selling out prematurely at rock-bottom margins.
Benchmark 3: Markdown Margin Erosion (The "Discount Hangover")
< 12% Total Blended Haircut Against MSRP
Promotions are necessary in modern retail, but lazy execution creates what veteran merchandisers call the discount hangover.
Here is the common story: A merchant launches a 48-hour weekend flash sale. Because native Shopify and BigCommerce control panels lack built-in promotional scheduling on standard plans, someone on the team edits hundreds of product prices on Friday afternoon. Sunday night arrives, someone forgets to revert the changes, and for the next three weeks, premium products continue selling at clearance rates.
Top-quartile ecommerce operators strictly protect their baseline gross margins. They know that a store running on a 50% gross margin that cuts prices by 20% must sell 67% more volume just to generate the exact same gross profit dollars.
The Fix: Stop running manual, open-ended price edits. Use scheduled price automation with automated rollback. When setting up a promotional campaign, pre-program both the discount trigger and the guaranteed reversion event:
Launch: Friday 18:00 EST  -> Set Compare-At = Current Price, Discount Price by 20%
Revert: Sunday 23:59 EST  -> Restore Original Price, Clear Compare-At Badge
For detailed steps on configuring hands-off campaigns, see our guide on how to schedule sales and revert prices automatically in Shopify.
Benchmark 4: Faceted Search & Attribute Completeness
> 92% Complete Product Specification Metafields
Modern shoppers do not browse catalogs by clicking through 40 pages of pagination. They filter. They check Color: Forest Green, Material: 100% Linen, Fit: Relaxed, and Size: XL.
In Shopify, these storefront facets are powered by Shopify 2.0 Metafields. In BigCommerce, they are powered by Custom Fields.
The silent conversion killer occurs when your data is incomplete or formatted inconsistently:
- If 300 shirts have
Material: Linenand 150 shirts have no material metafield populated, those 150 shirts vanish from the screen the instant a buyer applies the material filter. - If casing is inconsistent (e.g.,
Color: Navyvs.color: navy), search engines and filter widgets render duplicate, fragmented options that make your site look amateur.
Stores with greater than 92% attribute completeness record a 22% higher search-to-cart rate because shoppers find exactly what they want in fewer clicks.
The Fix: Never rely on CSV spreadsheets to manage key-value pairs—spreadsheets frequently corrupt delimiter characters and create duplicate keys. Instead, use visual in-app management to bulk edit Shopify metafields without code or bulk update BigCommerce custom fields across thousands of SKUs in seconds.
Benchmark 5: Monthly Catalog Sell-Through Rate (STR)
60% – 75% per 30-Day Seasonal Cycle
Sell-Through Rate (STR) is the pure truth metric of retail merchandising. It tells you what percentage of your inventory was converted into cash within a given measurement window.
While acceptable benchmarks vary by vertical, here is how the top quartile compares against industry medians:
| Industry Vertical | Median Retail STR (30 Days) | Top 10% Benchmark | Primary Inventory Risk |
|---|---|---|---|
| Fast Fashion & Apparel | 45% – 55% | 68% – 78% | Rapid seasonal obsolescence; broken size runs. |
| Beauty & Fragrance | 50% – 60% | 72% – 82% | Batch expiry dates; high SKU variant proliferation. |
| Consumer Electronics | 35% – 45% | 58% – 65% | Component depreciation; high carrying cost. |
| Home Decor & Furniture | 30% – 40% | 52% – 60% | Heavy freight costs; excessive warehouse storage fees. |
If your monthly STR dips below 40%, your working capital is frozen in physical inventory. That prevents you from investing in new seasonal winners or funding marketing campaigns.
The Fix: Implement dynamic velocity pricing. When a product's 14-day velocity drops below your target curve, trigger progressive, rule-based markdowns:
- Day 30 without sales: Apply 10% discount and bundle with high-velocity complementary items.
- Day 60 without sales: Increase markdown to 25% and feature in promotional collections.
- Day 90 without sales: Liquidation tier (40%+ off) to liberate tied-up warehouse cash.
Benchmark 6: Pricing Consistency & Psychological Formatting
> 98% Uniform Catalog Price Endings
When merchants automate price updates from supplier feeds or apply percentage markups (e.g., adding 15% to offset shipping inflation), math creates jagged, awkward price points. A $20.00 product marked up by 14% becomes $22.80; a $35.00 product becomes $39.90.
To a shopper, chaotic decimals look sloppy. They signal that the site is an automated dropshipper or that prices are arbitrarily inflated, subtly eroding checkout trust.
Top-tier ecommerce brands enforce strict, platform-wide psychological rounding conventions:
- Charm Pricing (.99 or .95): Proven to increase perceived value and transaction volume in direct-to-consumer apparel, footwear, accessories, and impulse items.
- Prestige Whole Numbers (.00): Clean whole numbers ($120.00, $350.00) signal luxury, artisanal craftsmanship, and premium brand equity in fine jewelry, luxury perfumes, and designer goods.
The Fix: Whenever you run a bulk price adjustment, combine percentage math with an automated rounding rule. Learn the exact process in our tutorial on how to bulk update prices by percentage with psychological rounding.
Benchmark 7: Product SEO & Rich Snippet Coverage
> 95% Unique Meta Descriptions & Image Alt Tags
In visually driven consumer categories (apparel, home decor, jewelry, cosmetics), Google Images accounts for up to 18% of organic discovery traffic. Furthermore, modern search engines penalize stores with hundreds of duplicate, auto-generated title tags like Classic T-Shirt – My Store Name.
When thousands of product photos lack descriptive alt attributes:
- You completely surrender Google Image search ranking positions to competitors.
- You fail ADA and Web Content Accessibility Guidelines (WCAG), opening your business to legal compliance risks.
- Search engine crawlers struggle to interpret product color, cut, and angle variations.
The Fix: Manually typing alt text for 10,000 photos across 2,000 SKUs is physically impossible for a lean ecommerce team. Instead, use dynamic token templating to bulk update image alt tags in Shopify for SEO:
Dynamic Pattern: [Product Title] in [Color] - Front View by [Vendor]
Rendered Alt:    Relaxed Linen Shirt in Forest Green - Front View by Northstar Goods
The Merchandising Health Scorecard: Where Does Your Store Rank?
How does your catalog hold up under scrutiny? Grade your store against the 7 operational benchmarks below:
| Operational Metric | Grade A (Elite Top 10%) | Grade B (Average Store) | Grade C (Margin Danger Zone) |
|---|---|---|---|
| Ghost SKU Ratio | < 15% active zero-sales | 15% – 35% | > 35% dead catalog clutter |
| OOS Exposure on Page 1 | < 4% of slots | 4% – 10% | > 10% sold out real estate |
| Margin Erosion / Markdowns | < 12% off MSRP | 12% – 20% | > 20% unmanaged discount bleed |
| Faceted Metafield Completeness | > 92% populated | 70% – 92% | < 70% missing attributes |
| Monthly Sell-Through (STR) | > 65% per 30 days | 45% – 65% | < 45% stagnant inventory |
| Pricing Decimal Consistency | > 98% standardized | 85% – 98% | < 85% jagged, random endings |
| SEO & Alt Tag Coverage | > 95% unique coverage | 75% – 95% | < 75% missing or duplicate |
Take Back Control of Your Catalog
If your self-audit landed your store in Grade B or Grade C territory, don't panic—almost every scaling brand experiences catalog drift. As product counts climb and marketing schedules speed up, keeping thousands of data points clean using spreadsheets and native control panels becomes humanly impossible.
The solution is not working longer hours inside fragile CSV files. The solution is adopting an operational system that manages your catalog through automated rules, scheduled workflows, and safe, previewable bulk updates.
Whether you operate on Shopify or BigCommerce, NorthStar Bulk Product Editor gives your merchandising team the tools to hit Grade A benchmarks every single week:
- Filter thousands of products by sales velocity, inventory, vendor, or tag in milliseconds.
- Apply percentage markups with automated psychological .99 or .95 rounding.
- Schedule flash sales with guaranteed automatic price rollbacks.
- Populate metafields, custom fields, and SEO alt tags at scale without touching code.
- Audit every change with a live diff preview and restore any previous version with 1-click rollback.
Stop letting catalog decay drain your acquisition ROI. Treat your catalog as your highest-leverage sales asset, hit your operational benchmarks, and give your store the foundation it needs to scale profitably. Looking for industry-specific conversion benchmarks? Explore our teardowns on luxury fragrance Scent UX and furniture & home decor e-commerce design trends.